ANNUAL SNOWBALLS
INTRODUCTION
If one resupply vessel is great,
multiple resupplies must be even greater!
SNOWBALL FROM OORT introduces the concept of a 7G cargo vessel launching from Sol and overtaking a previously launched 1G vessel, much slower with passengers (pax).

SNOWBALL FROM OORT shows how a cargo vessel can overtake the prior pax vessel exactly one year into its cruise phase.
MORE SNOWBALLS extend this profile with two variations.
First, suppose that mission planners decide to up the game and send an annual resupply vessel throughout the pax vessel's cruise period.
Second, consider a variable 1G vessel profile with different cruise velocities achieved by different durations of 1G acceleration (explained further below).
| RENDEZVOUS: SNOWBALL JOINS PAX VESSEL | |||||||||||||||||||||||||||||||||||||||||||||||||||||||||||||
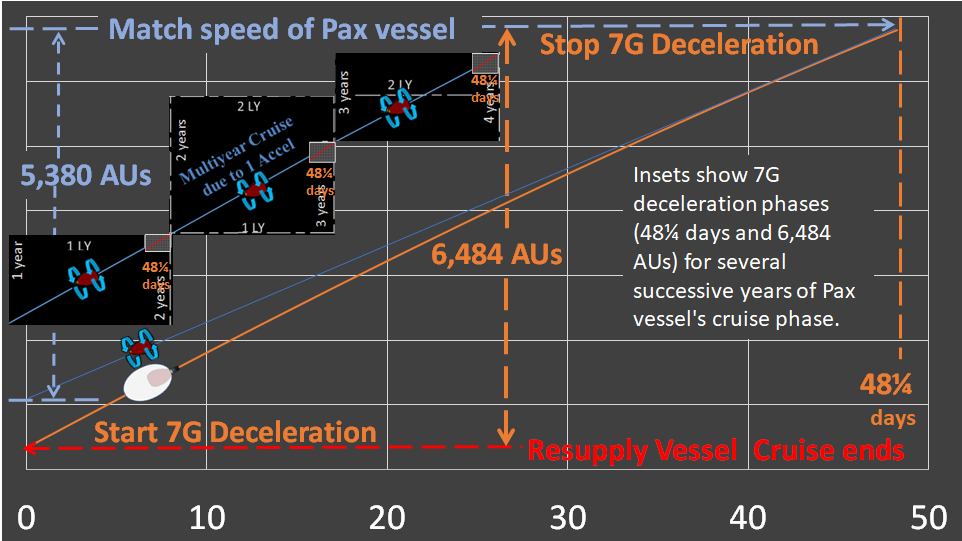 | |||||||||||||||||||||||||||||||||||||||||||||||||||||||||||||
| PREPARE FOR RENDEZVOUS. When the 7G snowball (habitat encased in ice) starts deceleration, it is 1,104 AUs (= 6,484 AU - 5,380 AU) behind the 1G vessel which rotates during cruise phase to simulate gravity. | DESIRED END STATE: Throughout the 48¼ day deceleration duration, this gap gradually decreases till they rendezvous at the end of this duration. Thus, 7G vessel precisely matches 1G vessel's cruise velocity at each Interception Point. | ||||||||||||||||||||||||||||||||||||||||||||||||||||||||||||
| 7G CRUISE START/STOP POINTS | |||||||||||||||||||||||||||||||||||||||||||||||||||||||||||||
 | |||||||||||||||||||||||||||||||||||||||||||||||||||||||||||||
| MATCH 1G CRUISE SPEED. At end of each snowball's cruise phase (Points: ⓐ ⓑ ⓒ ), it must decelerate for 48¼ days to match speed of Pax vessel (111.8 AU/day). | DESIRED END STATE: Resupply (7G) vehicle matches velocity of Pax vessel exactly upon interception. For rest of flight, vessels fly in tandem. CONCLUSION: Such maneuvers can happen multiple times during the flight. | ||||||||||||||||||||||||||||||||||||||||||||||||||||||||||||
| 7G ACCELERATIONS | |||||||||||||||||||||||||||||||||||||||||||||||||||||||||||||
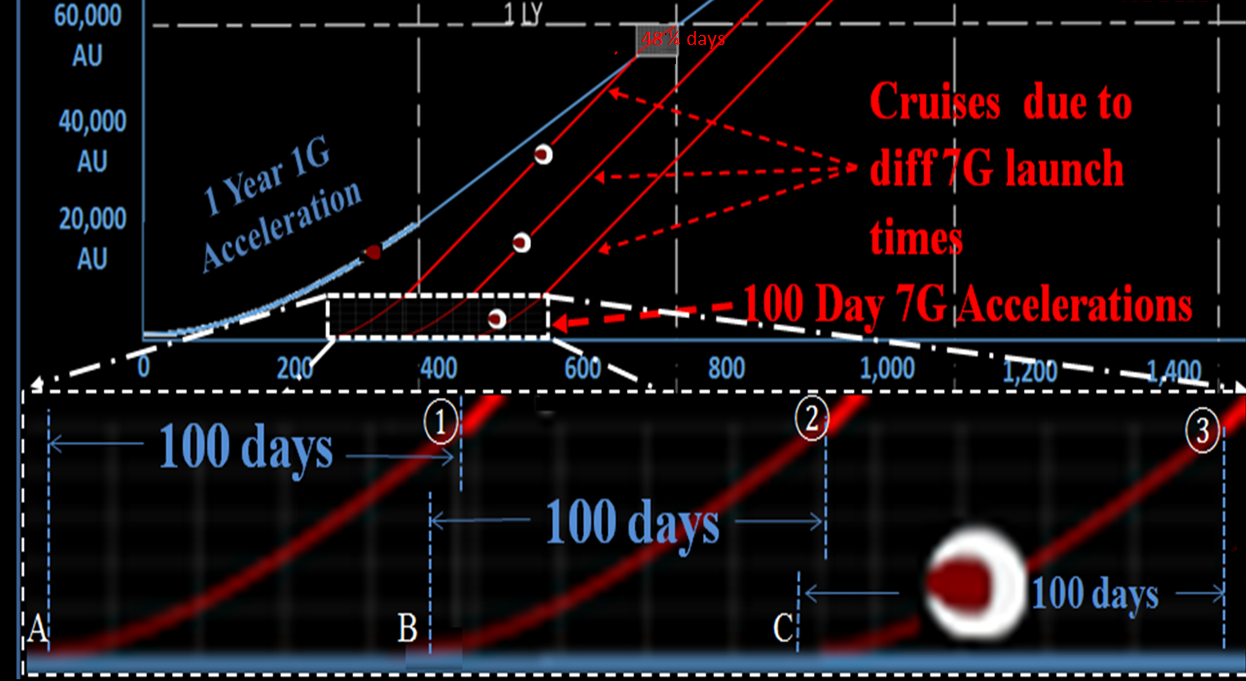 | |||||||||||||||||||||||||||||||||||||||||||||||||||||||||||||
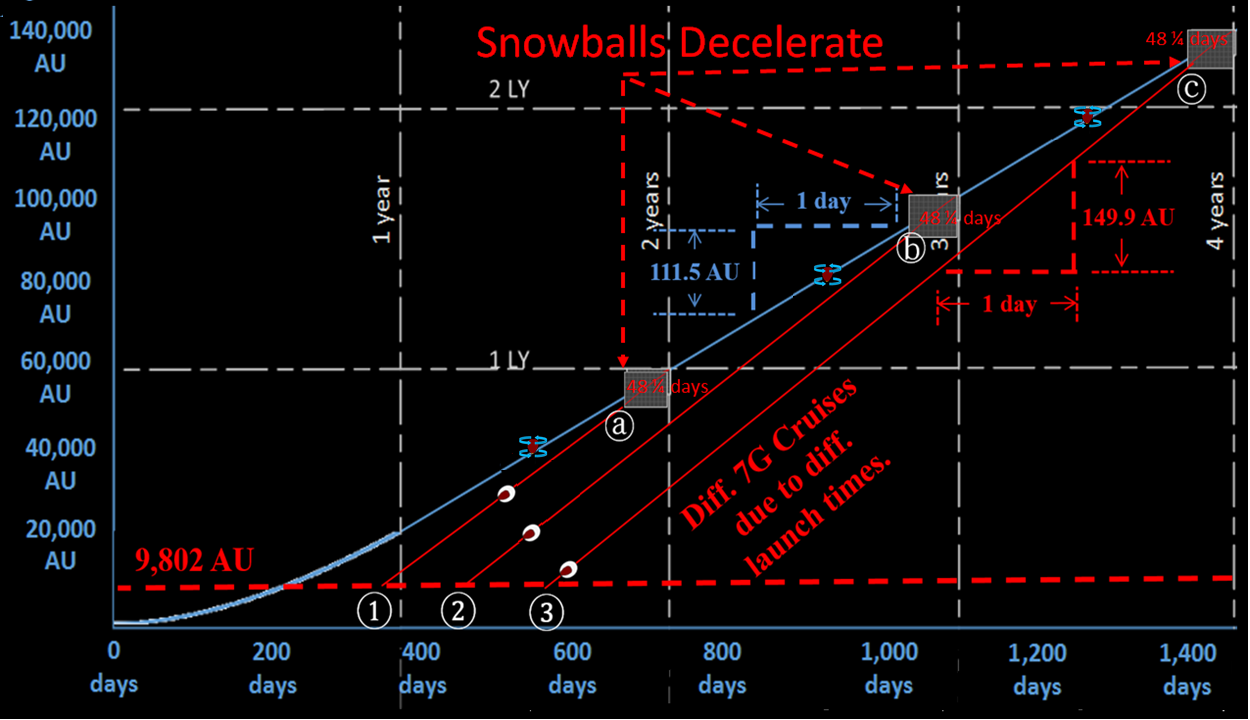
| 7G CRUISE SPEED. After 7G acceleration for 100 days and 9,802 AUs, snowball attains cruise velocity (149.9 AU/dy). For annual intercepts, assume that snowballs A, B, and C must start cruse at 360.2 days (①),453.7 days (②) and 547.3 days (③) respectively after pax vessel launches at 1G (zero days). | 7G LAUNCH LAGS 1G LAUNCH Thus, first snowball's launch time, A, lags pax launch by 260.2 days (= ① -100 days). Similarly, B lags by 353.7 days, and C lags by 447.3 days after Pax vessel launch. | ||||||||||||||||||||||||||||||||||||||||||||||||||||||||||||
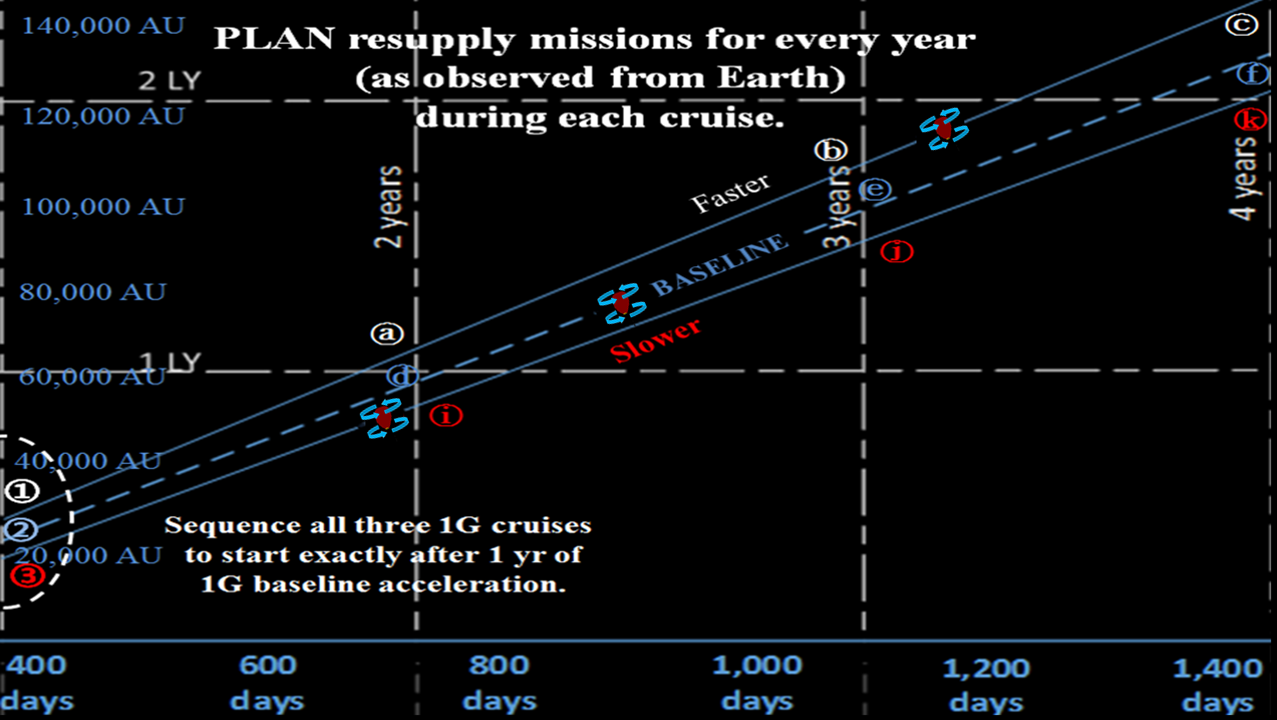
| ACHIEVE DIFFERENT 1G CRUISE SPEEDS by adjusting duration of 1G accelerations for Passenger vessel. | |||||||||||||||||||||||||||||||||||||||||||||||||||||||||||||
|---|---|---|---|---|---|---|---|---|---|---|---|---|---|---|---|---|---|---|---|---|---|---|---|---|---|---|---|---|---|---|---|---|---|---|---|---|---|---|---|---|---|---|---|---|---|---|---|---|---|---|---|---|---|---|---|---|---|---|---|---|---|
| FASTER CRUISE SPEEDS come from longer accelerations. EXAMPLE: 1G propulsion for 1.1 year (401.7 days) takes vessel to a velocity of 117.9 AU/day over a distance of 28,072 AU.
BASELINE: By comparison, 1G propulsion for 1.0 year takes vessel to 111.8 AU/day and 23,876 AUs.
SLOWER CRUISE SPEEDS come from shorter accelerations. EXAMPLE: 1G propulsion for .9 year (328.7days) takes vessel to a 105.1 AUs/day over 19,913 AUs. |  | ||||||||||||||||||||||||||||||||||||||||||||||||||||||||||||
| BASELINE 1G ACCELERATION | |||||||||||||||||||||||||||||||||||||||||||||||||||||||||||||
| For convenience, arbitrarily define BASELINE 1G acceleration profile with a duration of 1 year; thus, start acceleration at day 0 and end after 365.25 days. Resultant Velocity becomes vessel's cruise velocity. See dashed line on above diagram. NOTE: To readily compare different cruise phases (following frames), arrange acceleration start times for all cruises to start at a common time at 365.25 days. For faster cruise, increase baseline acceleration duration by 10% from 365.25 days to 401.7. Thus, start faster acceleration at -36.45 days (before day zero, BASELINE start.) For slower cruise, decrease baseline acceleration duration by 10% from 365.25 days to 328.7 days. Thus, start slower acceleration at +36.55 days (after day zero, BASELINE start.) | ||||||||||||||||||||||||||||||||||||||||||||||||||||||||||||
| SLOWER THAN BASELINE TO ALPHA CENTAURI | |||||||||||||||||||||||||||||||||||||||||||||||||||||||||||||
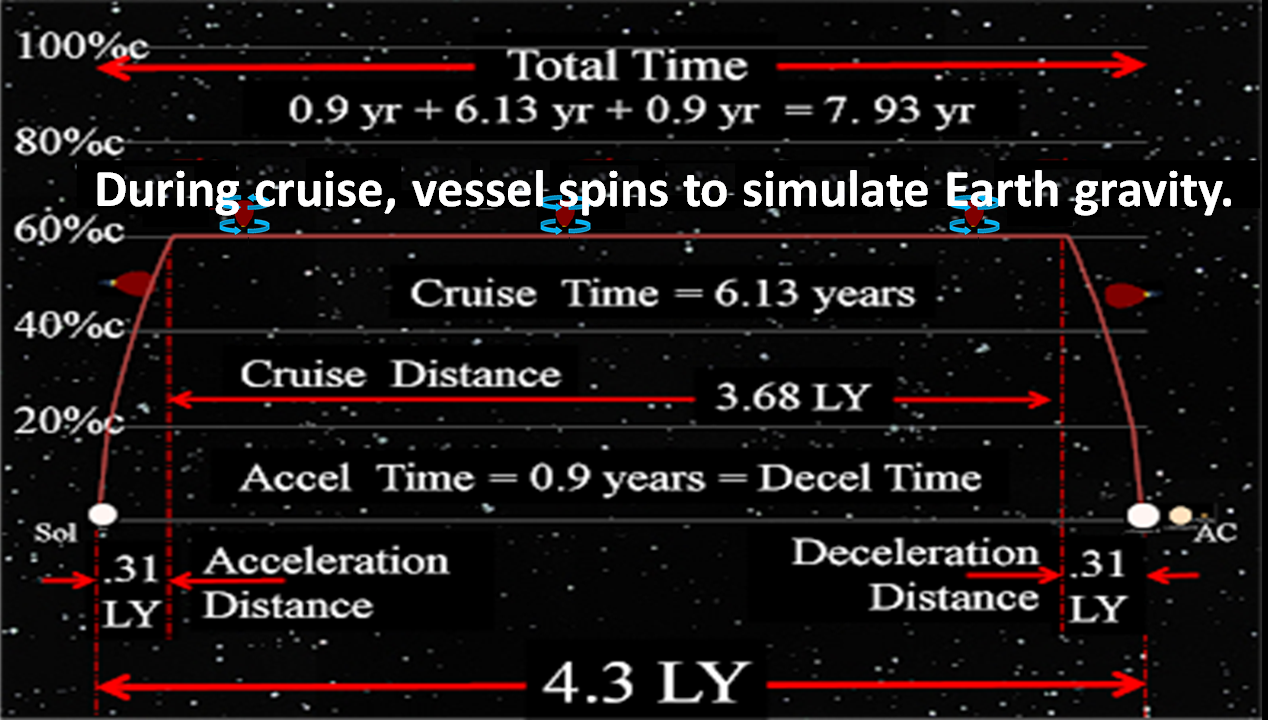 | EXAMPLE: Consider a slower than baseline trip to our nearest stellar neighbor, Alpha Centauri, with total distance (dTtl) from Sol of 4.3 Light Years (LYs). Typical interstellar flight profile includes:
| ||||||||||||||||||||||||||||||||||||||||||||||||||||||||||||
| PREPLANNED ANNUAL INTERCEPTS | |||||||||||||||||||||||||||||||||||||||||||||||||||||||||||||
For each year (as observed from Earth) of each vessel's cruise phase, one could plan for each 1G vessel to intercept a 7G resupply vessel.
|  | ||||||||||||||||||||||||||||||||||||||||||||||||||||||||||||
| SNOWBALLS DECELERATE TO MATCH PAX CRUISE SPEED | |||||||||||||||||||||||||||||||||||||||||||||||||||||||||||||
 |
NOTE: See 7G deceleration values from following link:(7G Dec) | ||||||||||||||||||||||||||||||||||||||||||||||||||||||||||||
| MATCH SPEED OF 1G's FASTER CRUISE (117.9 AU/day): To match this velocity, 7G vessel must decelerate from its cruise speed (149.9 AU/day) for 43 days over a distance of 5,843.2 AUs. | |||||||||||||||||||||||||||||||||||||||||||||||||||||||||||||
| BASELINE CRUISE speed is arbitrarily chosen as vessel velocity (111.8 AU/day) attained after 1 year of 1G propulsion: Thus, 7G vessel must decelerate for 48.25 days over a distance of 6,444.9 AUs. | |||||||||||||||||||||||||||||||||||||||||||||||||||||||||||||
| MATCH SPEED OF 1G's SLOWER CRUISE (105.1 AUs/day): Due to greater velocity differential, 7G vessel must decelerate for a longer duration, 53.4 days, and a greater distance, 6,974.1 AUs. | |||||||||||||||||||||||||||||||||||||||||||||||||||||||||||||
| DETERMINE "START POINT" OF 7G DECELERATION | |||||||||||||||||||||||||||||||||||||||||||||||||||||||||||||
Consider Selected Annual Intercepts
Assume measurements accomplished by Earth bound observers.
| 
After slight 7G deceleration interval, resupply vessel matches velocity of pax vessel at exact time/distance (Selected examples include points: ⓐ , ⓔ, ⓚ.) Thereafter, both vessels travel in tandem.
| ||||||||||||||||||||||||||||||||||||||||||||||||||||||||||||
| 7G CRUISE SEGMENTS | |||||||||||||||||||||||||||||||||||||||||||||||||||||||||||||
 | End point of 7G cruise segment; coincides with start point of 7G Deceleration
coincides with endpoint of 7G Acceleration. | ||||||||||||||||||||||||||||||||||||||||||||||||||||||||||||
| SNOWBALL'S 7G PROFILE | |||||||||||||||||||||||||||||||||||||||||||||||||||||||||||||
7G profile ends with 48.25 days of 7G deceleration. EachEach 7G profile starts with 100 days of 7G acceleration. EachEach 7G profile starts with 100 days of 7G acceleration. |
S-1: GREAT OAK OF ASTRONOMY

(28 April 1900 - 5 November 1992)
Subrahmanyan Chandrasekhar: "The great oak of Astronomy has been felled, and we are lost without its shadow". | ||||||||||||||||||||||||||||||||||||||||||||||||||||||||||||
| SUMMARIZE 7G RESUPPLY SOLUTION | |||||||||||||||||||||||||||||||||||||||||||||||||||||||||||||
S-2: JAN OORT'S BRIEF BIO Jan Hendrik Oort was a Dutch astronomer; best known for Oort Cloud of comets which bears his name. Oort Cloud is the de facto boundary of our Solar System.
In 1935, Dr. Oort became professor at the observatory of the University of Leiden; Ejnar Hertzsprung was the director. (Dr. Hertzsprung is well known for the Hertzsprung-Russell diagram, an essential tool in the study of stars.) Fascinated by radio waves from the universe, Dr. Oort pioneered radio astronomy with an old radar antenna confiscated from the Germans after WWII. Radio interferometry was suggested by Oort well prior to their experimental tests by others (Ryle in Cambridge and Pawsey in Sydney). In the 1950s, he raised funds for a new radio telescope in Dwingeloo, in the east part of the Netherlands, to research the center of the galaxy. In 1950, Dr. Oort observed most comet origins to be within the Solar System. HYPOTHESIS: SOL IS SURROUNDED BY BILLIONS OF COMETS. While very few enter the inner Solar System, and even fewer are observed; an analysis of these few indicate the existence of the Oort Cloud. |
Summarize 7G Resupply Solution
1) Determine Annual Intercepts of 1G Cruises. Plan for resupply vessels to join passenger vessels at specific time/distance points. For convenience, arbitrarily choose these points at one year intervals (as measured by Earth observers).
2) Determine Start Point of 7G Deceleration. 7G vessel must decrease its cruise velocity (from 149.9 AU/day) to precisely match velocity of its target pax vessel (1G cruise velocity of about 110 AU/Day.) 3) Determine Start Point of 7G Cruise. Upon completion of 7G acceleration (100 days), Resupply Vessel starts the cruise portion of its journey at 149.9 AU/day. 4) Determine Start Point 7G Accelerations at 100 days prior to corresponding end-times. (Recall these end-times coincide with start-points of 7G cruise segments.) | ||||||||||||||||||||||||||||||||||||||||||||||||||||||||||||
| 1G ACCELERATION DURATIONS | |||||||||||||||||||||||||||||||||||||||||||||||||||||||||||||
COMPARE INTERSTELLAR
FUEL CONSUMPTIONS:
Consider different 1G profiles due to
different 1G acceleration durations Following three examples consider 1G acceleration durations of .9 year, 1.0 year and finally 1.1 years. HYPOTHESIS: Increased durations increase fuel consumptions. |
S-3: JAN OORT DISCOVERY EXAMPLES Oort's other discoveries include:
| ||||||||||||||||||||||||||||||||||||||||||||||||||||||||||||
| |||||||||||||||||||||||||||||||||||||||||||
|---|---|---|---|---|---|---|---|---|---|---|---|---|---|---|---|---|---|---|---|---|---|---|---|---|---|---|---|---|---|---|---|---|---|---|---|---|---|---|---|---|---|---|---|
| |||||||||||||||||||||||||||||||||||||||||||
| |||||||||||||||||||||||||||||||||||||||||||
CONCLUSION: More Propulsion Time Requires More Fuel.
AXIOMATIC: Most interstellar voyages require same energy for deceleration as for acceleration. | |||||||||||||||||||||||||||||||||||||||||||
For 1G profile, following three variations assume: deceleration energy = acceleration energy
| |||||||||||||||||||||||||||||||||||||||||||
For all 3 1G variations, resupply vessels use 100 days of 7G acceleration
to high speed cruise (149.9 AU/day). Thus for all 3 variations: t7G-Acc = 100 days f7G-Acc = (1 - (1 - 7×Δ)100) GW0 = .2882 GW0
| |||||||||||||||||||||||||||||||||||||||||||
| VOLUME 0: ELEVATIONAL |
|---|
| VOLUME I: ASTEROIDAL |
| VOLUME II: INTERPLANETARY |
| VOLUME III: INTERSTELLAR |
posted by JimODell at 2:46 AM
![]()
![]()

1 Comments:
Jim - Congratulations on the excellence of your presentation! Your methodical approach, giving each factor due consideration, has the makings of a textbook, but the exposition would suit a wider readership as well. Your idea regarding use of a particle accelerator as a drive falls naturally out of your material, but is not the first thing a space enthusiast would consider.
My own interest is in bootstrapping a space economy in the inner solar system based on use of asteroid materials and sunlight. Best regards and thanks again for the well-directed effort!
Post a Comment
<< Home